
Executive Summary
This publication of NetBeacon MAP: Monthly Analysis contains data from May 2026. Refer to the background section for more information about this initiative and the NetBeacon Institute. Key highlights from our overall data include:
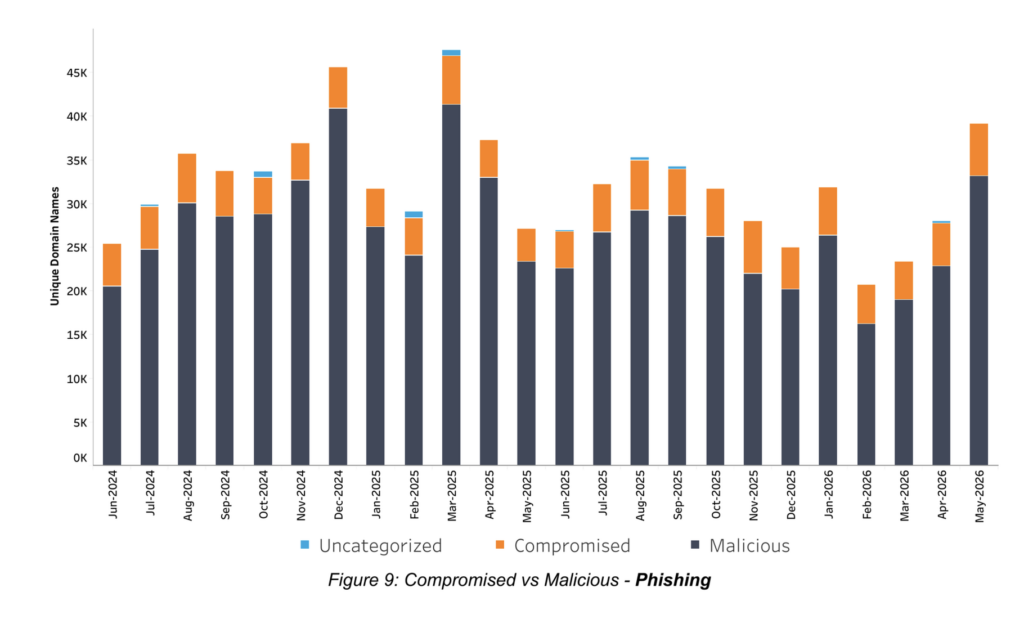
- A month-to-month increase in unique domains used for phishing attacks. Our methodology identified 39,267 unique domains engaged in phishing attacks in May 2026 compared to 27,980 in April 2026.
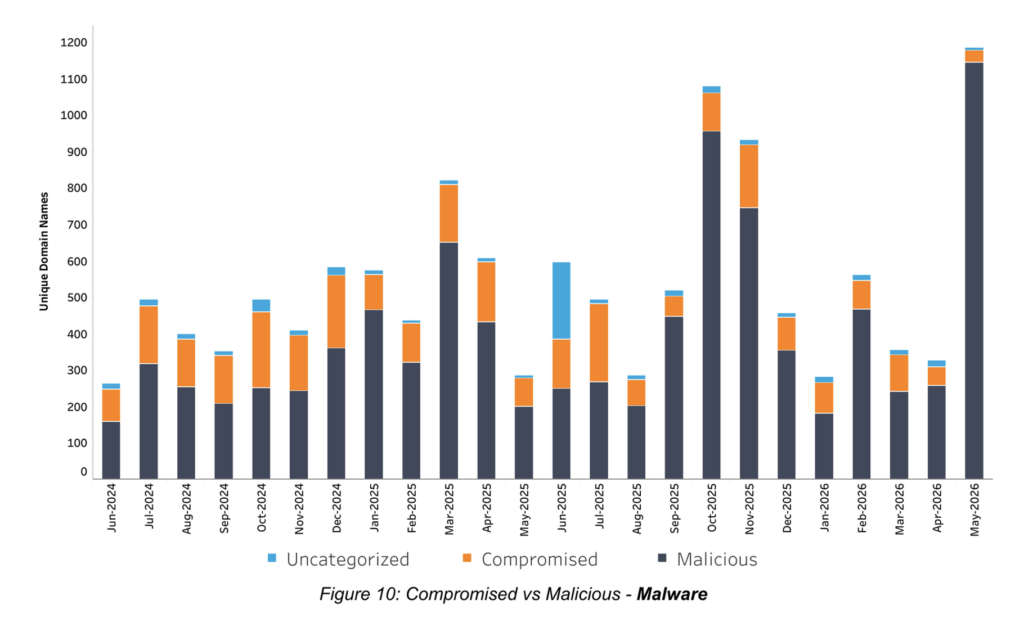
- A month-to-month increase in unique domains used for malware distribution. May 2026 recorded 1,186 unique domains compared to 328 in April 2026, the highest in the last 24 months. Our observed data shows that malware numbers tend to fluctuate more than phishing. The highest month on record is 13,941 in December 2022, and the lowest was 163 in August 2023.
- Mitigation rates are considerably higher for malicious registrations (89%) than mitigation rates for compromised websites (49%). We’ve also included a breakdown of mitigation rates split between malicious and compromised. More details are available on our website.
- More than a third of unique domains (38%) had a median mitigation time of 24 hours or less. These median mitigation times include compromised websites and maliciously registered domain names.
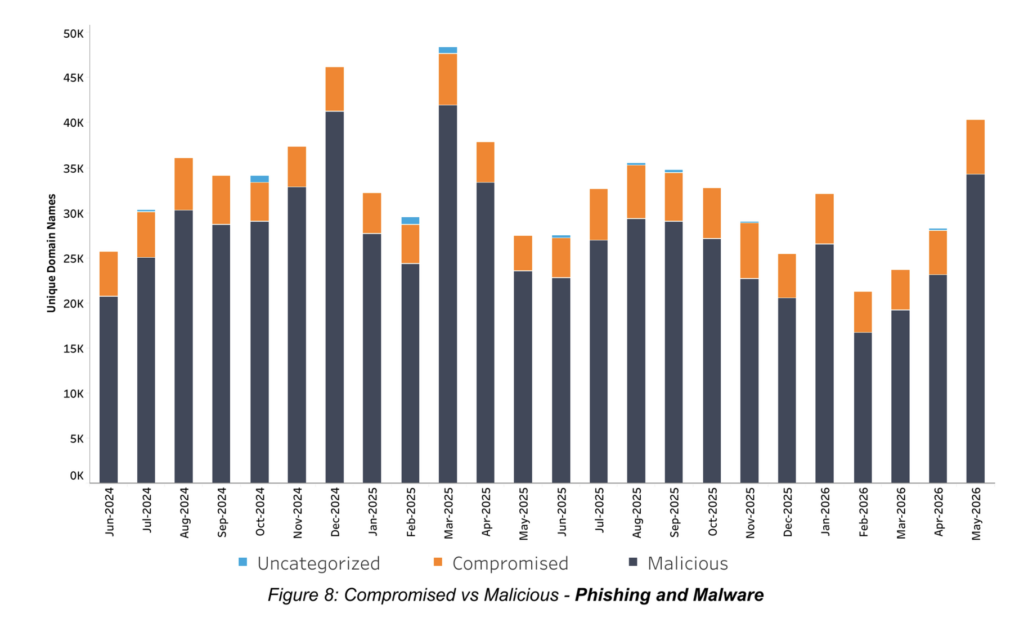
- In May, our methodology observed that 85% of phishing domains were maliciously registered, while 97% of malware domains were malicious domains. This is an exceptionally important distinction when it comes to mitigation; typically the registry and registrar are not well placed to appropriately mitigate harm related to a compromised website. This usually requires action from the web hosting provider or registrant. In terms of the type of registration, we typically see more compromised websites associated with malware distribution and more maliciously registered domains associated with phishing attacks.
Registrars and Top Level Domains (TLDs): To understand how phishing and malware is distributed across the ecosystem, we continue to publish our Specific Reporting tables which identify registrars and TLDs with relatively high or low rates of abuse per 100,000 Domains Under Management (DUM), or new registrations.
General DNS Abuse Trends
General DNS Abuse Trends are useful for understanding phishing and malware across the DNS ecosystem and high level trends over time. This section shows high-level, aggregate data for all months on record at the time of publication.
Note: Reporting is delayed by two months to allow for the measurement of mitigation.
Chart 1: Aggregate Trends
This chart provides a high-level view on how much DNS Abuse has been identified by our methodology, and how DNS Abuse is changing over time. It shows the absolute volume of unique domains our methodology has identified that are engaged in phishing or malware, broken out by category. The figures below show a stacked 100% bar chart. To view the chart as a count of unique domain names, visit our Interactive Charts. For more information: Chart 1: Aggregate Trends
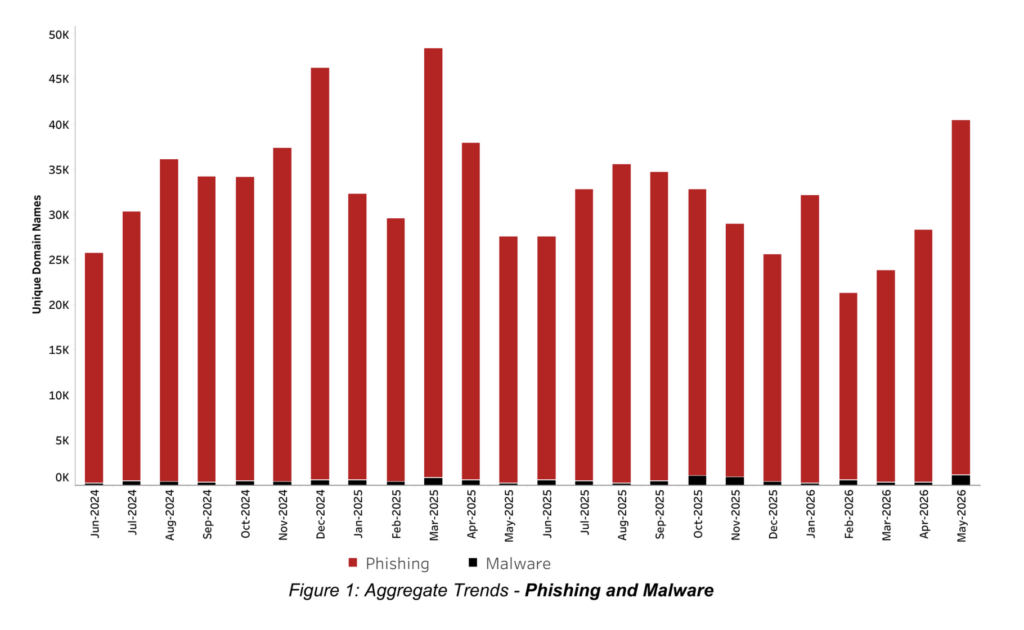
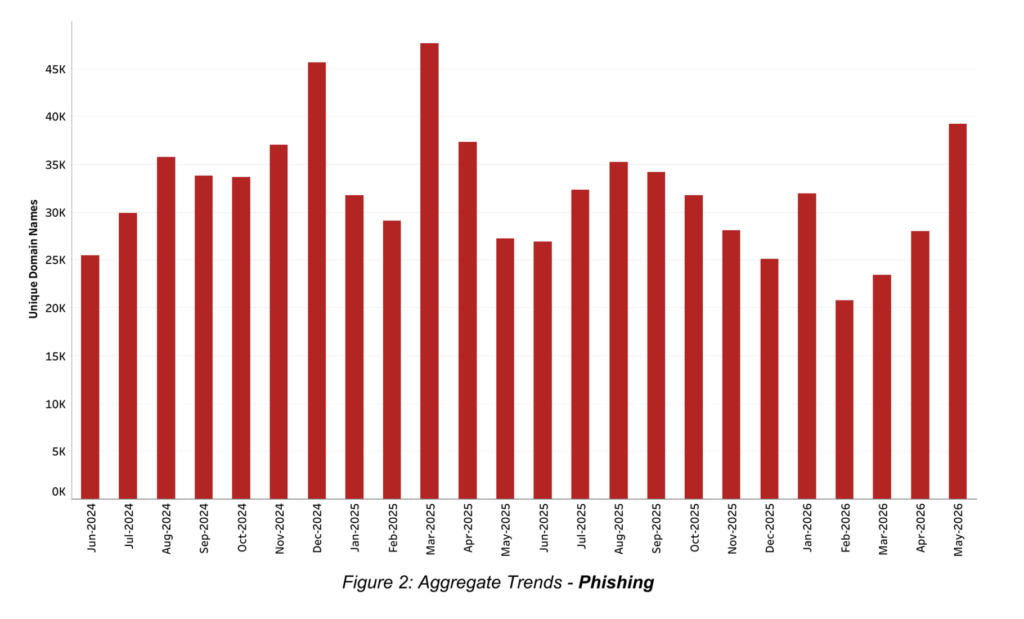
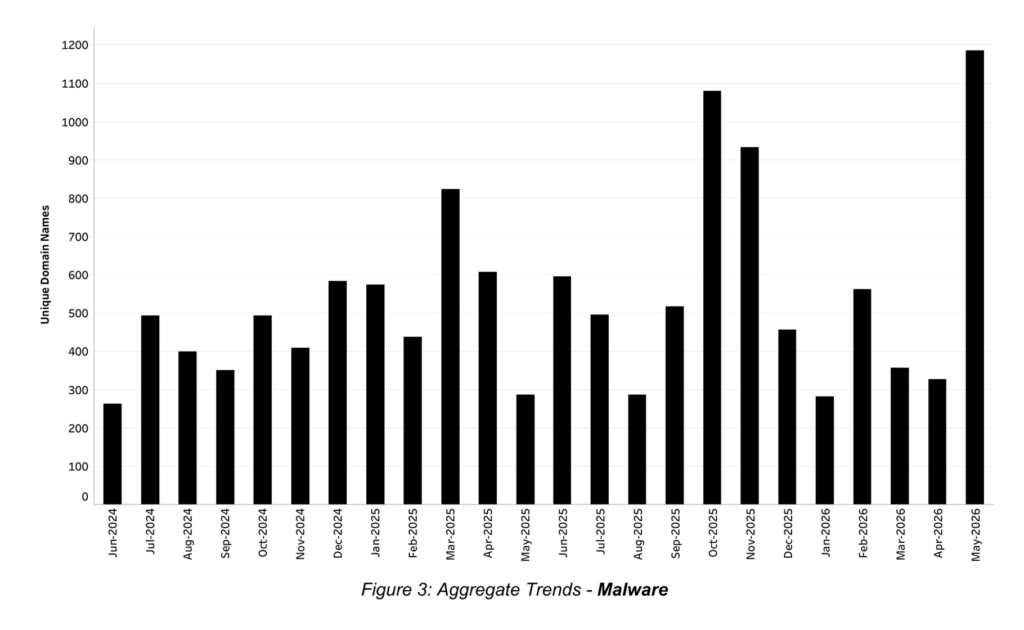
Chart 2: Mitigation
This chart provides a high-level view on how much DNS Abuse mitigation has been identified by our methodology, and how it’s changing over time. To view this chart as a count of unique domain names and filter by registration type, visit our Interactive Charts. For more information: Chart 2: Mitigation
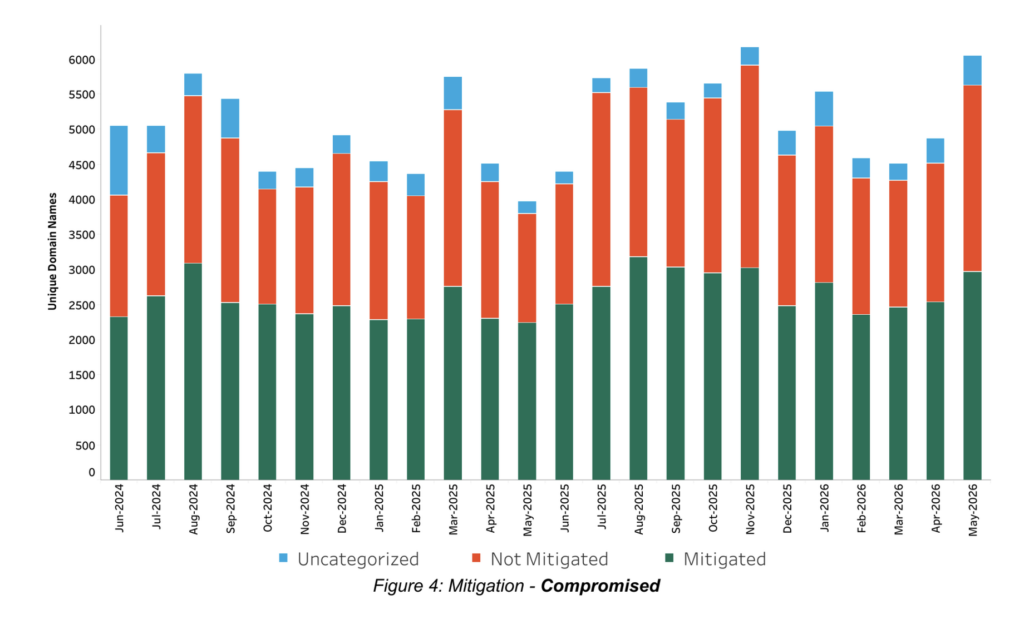
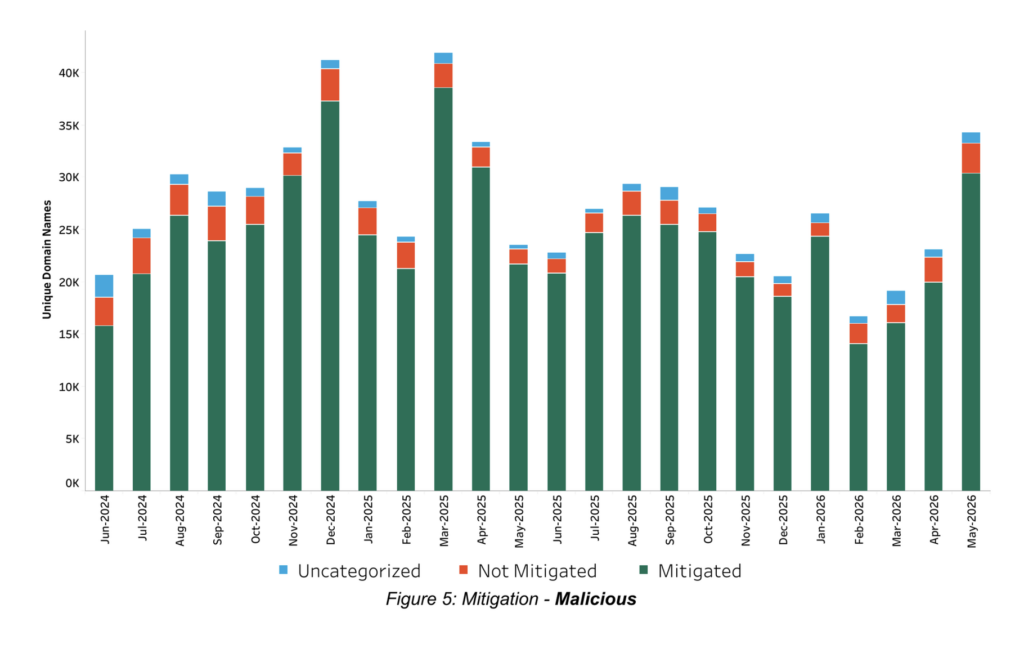
Chart 3: Registrar Median Mitigation Time
This chart is intended to show the observed time taken to mitigate phishing and malware, and how it is changing over time. For the domains that our methodology determined were mitigated, this chart shows how many unique domains were associated with a registrar credential that had a median time to mitigation in each category. These figures show count of unique domain names, to view the chart as a stacked 100% bar chart, visit our Interactive Charts. For more information: Chart 3: Registrar Median Mitigation Time.
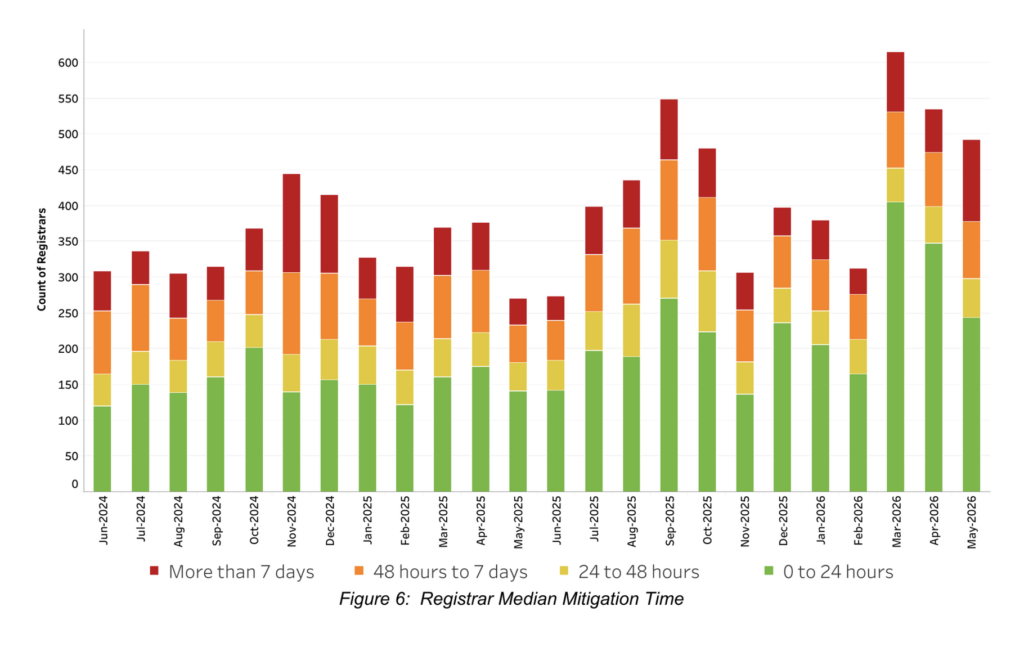
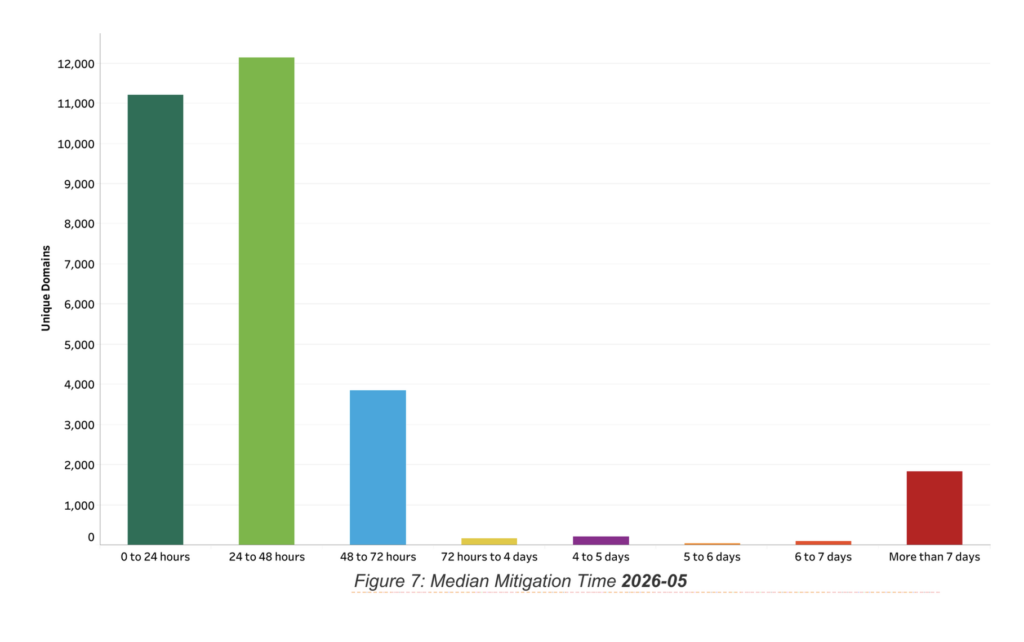
Chart 4: Malicious vs. Compromised
This chart is intended to show the observed registration type (malicious vs. benign but compromised) and how this is changing over time. For more information, visit our Interactive Charts. For more information: Chart 4: Malicious vs. Compromised.
Specific Reporting
We provide registrar and TLD level data on the relative concentration of observed malicious phishing and malware. This section shows data for the most recent month on record.
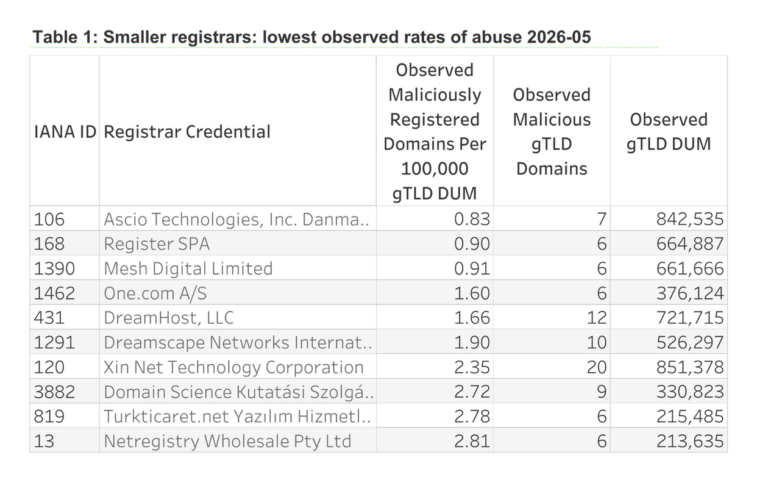
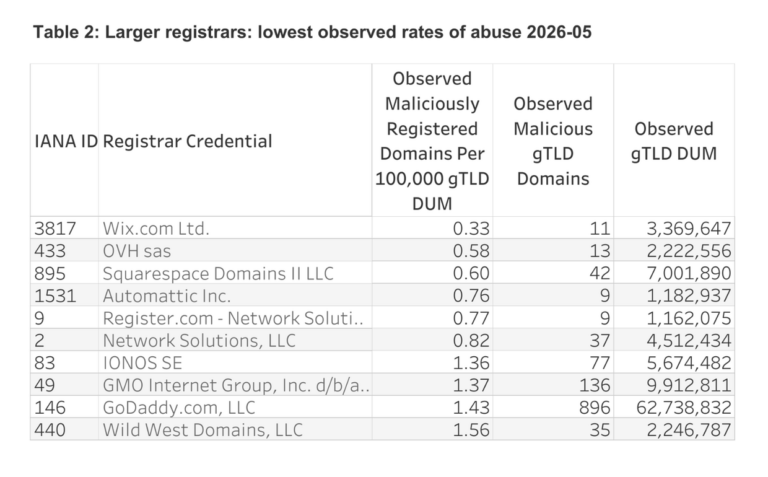
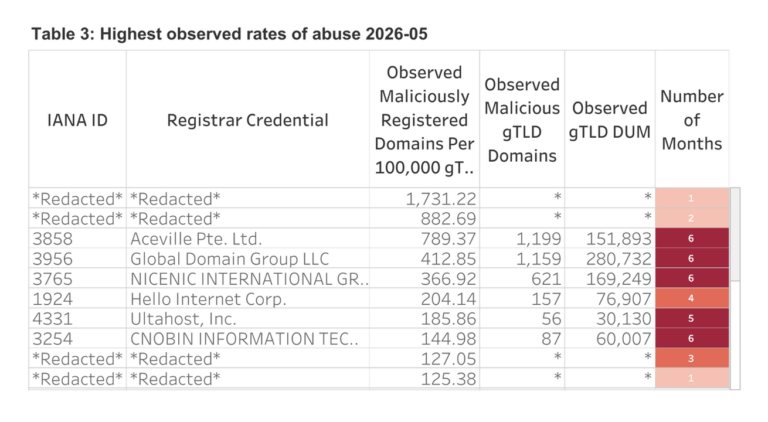
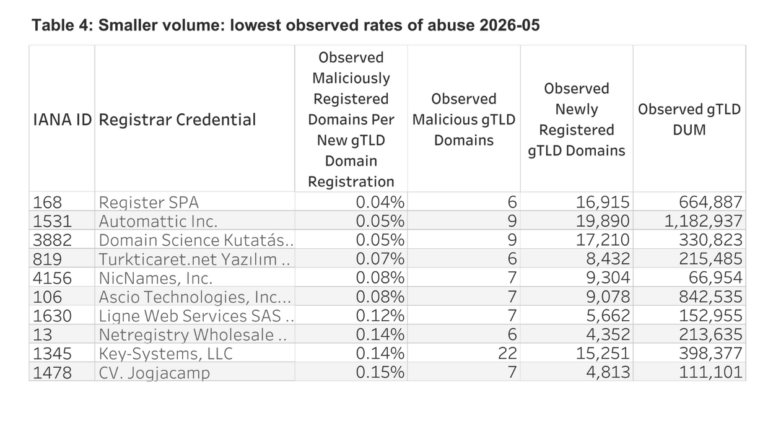
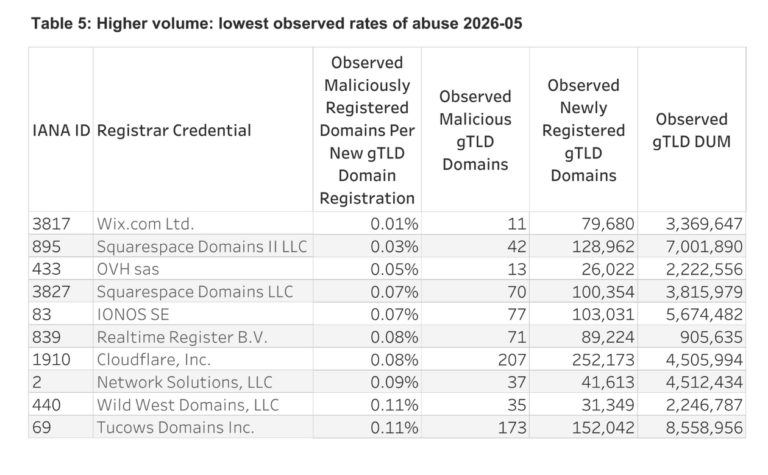
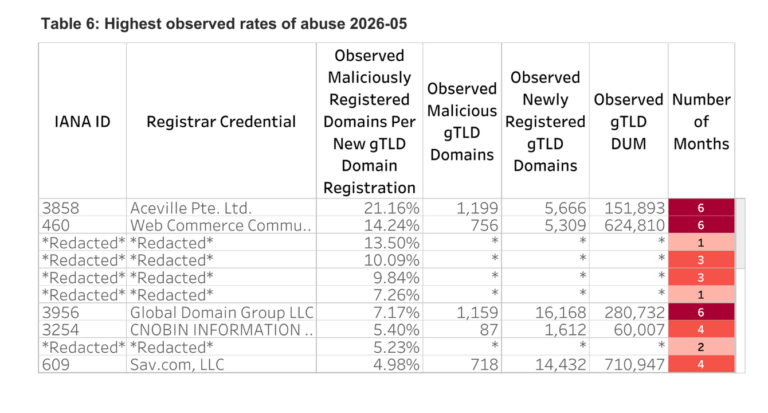
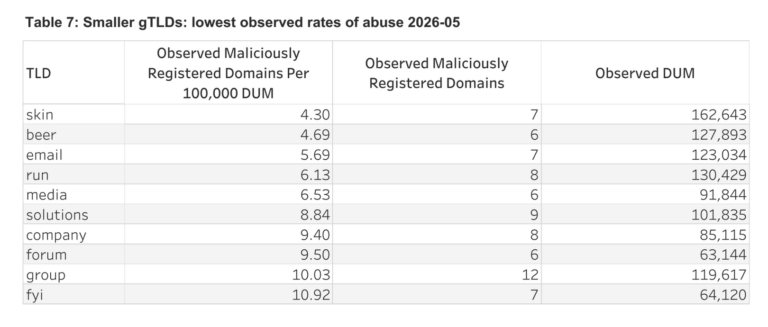
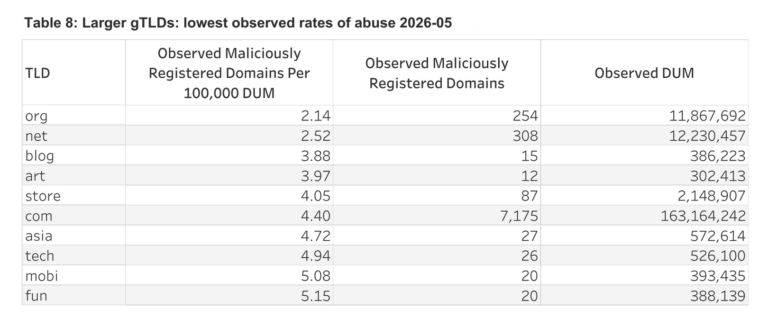
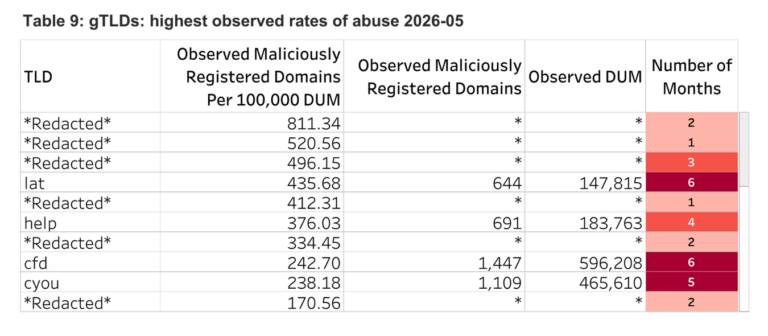
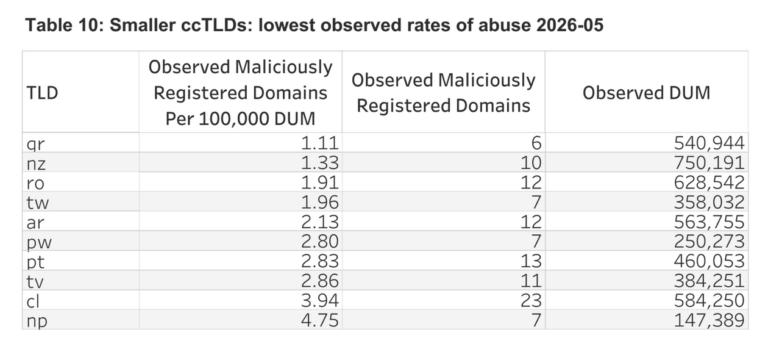
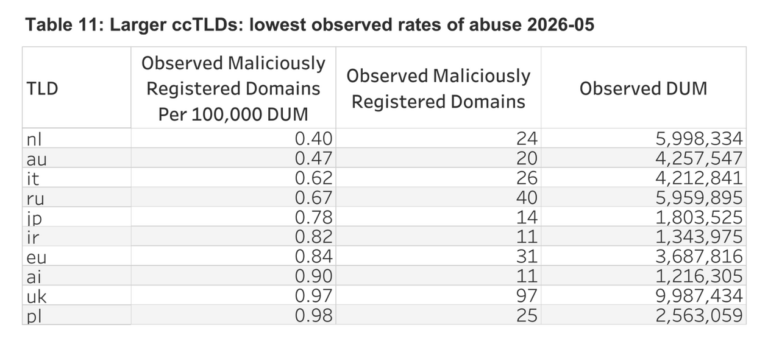
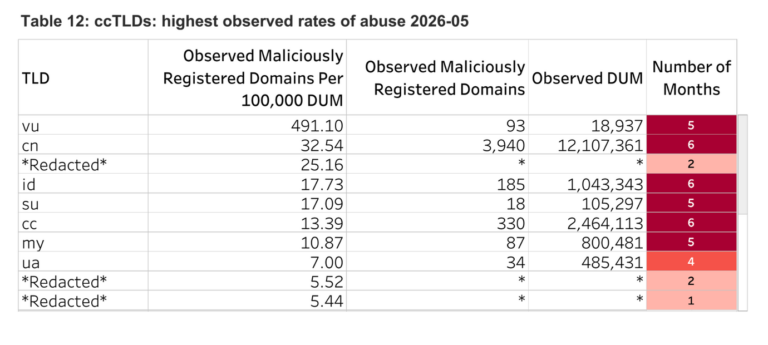
There are four metrics: two relating to registrars and two relating to Top Level Domains (TLDs). Each metric includes three tables. The first two tables per metric identify the lowest rates of abuse: one table for larger registrars/TLDs, and one table for smaller registrars/TLDs. The final table in each metric identifies the highest rates of abuse.
Rates of abuse | Lowest | Lowest | Highest |
Size | Smaller | Larger | All |
Registrars: DUM | Table 1 | Table 2 | Table 3 |
Registrars: new registrations | Table 4 | Table 5 | Table 6 |
gTLDs | Table 7 | Table 8 | Table 9 |
ccTLDs | Table 10 | Table 11 | Table 12 |
Note: Reporting is delayed by two months to allow for the measurement of mitigation.
Registrars: DUM
Registrars: New Registrations
Generic Top Level Domains
Country Code Top Level Domains
Background
The NetBeacon Institute (“Institute”) was created in 2021 by Public Interest Registry (“PIR”) in pursuit of its non-profit mission. The Institute aims to reduce DNS Abuse and empower the DNS Community.
This report is the Monthly Analysis from NetBeacon Measurement & Analysis Platform (MAP) (“NetBeacon Map”). This initiative is a collaboration with KOR Labs, led by Dr Maciej Korczynski a professor at Grenoble Alpes University in France. It focuses on the use of the Domain Name System (DNS) for phishing and malware.
Our priorities for NetBeacon MAP are:
- Transparency: The methodology that collects, cleans, and aggregates the data must be as transparent as possible. To the extent that anyone should wish to, they could replicate the process.
- Credibility and Independence: We aim to have an academically robust and independent approach, separate from commercial interests.
- Accuracy and Reliability: The goal of these reports is to enable focused conversations, and to identify opportunities for abuse reduction. The data needs to be of high enough quality to serve as the foundation for meaningful changes to the ecosystem.
In this Report, we provide General DNS Abuse Trends which are a snapshot of the interactive charts available on our website.
We provide Specific Reporting which identifies registrars and Top Level Domains (TLDs) with high and low relative levels of malicious phishing and malware in their domains under management (DUM). We also identify registrars with higher and lower rates of malicious phishing and malware compared to new registrations.
We encourage all registrars and registries to get in contact with us and take the opportunity to view the data associated with their registrar or registry.
The Executive Summary provides monthly commentary and insight for the current report.
Our methodology is available on our website. It provides important context and we recommend it is read in full. We offer a number of options for consuming NetBeacon MAP data: see our website for more information.
Our approach is one of collaboration and engagement, and we endeavor to speak to interested parties and provide them with early access to data that concerns their organization. We are committed to refining this project as work continues and welcome insights from across the industry to help us iterate and improve. If you would like to review your data, please contact: support@netbeacon.org
NetBeacon MAP operates independently of NetBeacon Reporter, the centralized abuse reporting service we created for the benefit of the DNS. Reports from NetBeacon Reporter do not go into our measurement work with NetBeacon MAP. This is a conscious choice to optimize and encourage usage of NetBeacon Reporter and prevent any abuse of NetBeacon Reporter as an attempt to influence NetBeacon MAP data. See the methodology for more information on how domains are included in NetBeacon MAP.