Since collecting and publishing data on the number of unique domains used for phishing attacks and malware distribution as part of our NetBeacon MAP reporting, we’ve been on the lookout for any discernible patterns or trends.
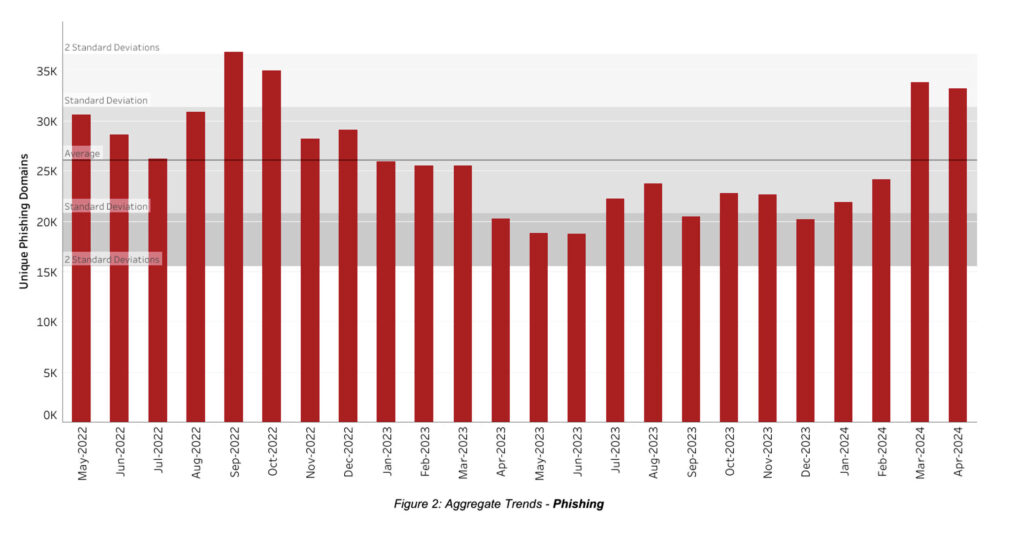
In our NetBeacon MAP data, we noticed an increase in the February numbers compared to January, with unique phishing domains up 11% to 24,232 from 21,917. When we looked at the underlying data, we found that most of this appeared to be concentrated in two specific TLDs and four registrars.
Case Study 1
We studied one of the TLDs for which the number of maliciously registered domain names increased significantly between January and February 2024. Starting from mid-February, we observed up to a few hundred suspicious third-level domain names per day on blocklists. These domains generally consisted of a random string at the third-level label and occasionally two concatenated dictionary words at the registered domain name label. The domains were typically registered a few weeks prior using two registrars.
The analyzed domain names were behind reverse proxies, (services that obfuscate the webhost), and the websites displayed content in Japanese. The sites did not exhibit obvious malicious activity. An extensive manual analysis of the screenshots and website content revealed that these sites generally offered products for sale, often promoting discounts or limited editions, indicating the possibility of online fake shop scams. The analysis identified recurring titles such as “Your coupon is now available,” “Speedy delivery nationwide,” and “Limited items are available at affordable prices,” (all in Japanese). We discovered that product descriptions did not necessarily correspond to the products visible on the webpages. However, the collected evidence is anecdotal and stems from the analysis of recurring patterns across multiple domains and web content. This demonstrates one of the challenges with evidencing abuse. However, the majority of these domains were mitigated, which seems to indicate abuse was present.
When our March 2024 NetBeacon MAP data arrived, it was higher again, with 33,809 unique domains, a 39.5% increase relative to February. If we look at the month-on-month increase, bearing in mind that February was already slightly elevated, the increase is generally concentrated in five registrars and three TLDs (which included 2 gTLDs, and 1 ccTLD).
Case Study 2
We manually analyzed one TLD from the March data and identified over 2,800 phishing URLs, where the domain name included a string of a shipping service at the third-level domain name label. Our classifier flagged these registered domain names as ‘malicious’, rather than ‘benign but compromised.’ The phishing websites were generally constructed using the same technologies, had identical titles, were hosted on a limited number of networks, and were registered through a handful of registrars. They also displayed the same screenshot of the phishing website, sporadically redirecting to the official website of the targeted (shipping) service. This analysis indicates that they were part of the same phishing campaign.
February’s increase in our March data was within the usual monthly variability, and within one standard deviation and below average, as can be seen in Figure 2 below. The increase in March however is the single largest increase we’ve seen to date, though not the highest month in absolute numbers (September 2022 holds this record).
Our April 2024 data has been published and reports 33,228 unique domains observed as related to a phishing attack. This is a 1.7% decrease month-on-month. However, relative to our other months on record, the numbers still remain higher than observed in 2023.

So how can the domain community best understand this data? At the Institute, we try to avoid drawing conclusions on causality because of the challenges in doing so accurately. This blog is no exception. The commentary provided should be taken as our thoughts on possible reasons based on observing the data. We hope this stimulates curiosity and discussion in the community.
Commentary
We have often wondered about seasonal peaks and dips in phishing, but did not observe a similar pattern in February and March last year. Could this be related to a specific sale or promotion, or the result of fast growth for some registrars or TLDs—a commonly stated anecdotal driver of abuse. From our initial analysis of the data, it looks like there is some concentration amongst specific registrars and TLDs, leading us to wonder whether there were specific factors that impacted registrations. Alternatively, perhaps those operators were simply unlucky targets of malicious activity for the given month.
Attempting to understand these challenges is a reminder that measuring DNS Abuse is difficult and relies on an imperfect starting point: reputation blocklists which are typically designed for network protection (not DNS level mitigation) and will, from time to time, change their methodologies.
It’s also a reminder that we, as a community, are still grappling to understand the fundamental drivers of DNS Abuse. On that front, we look forward to seeing the readout from Inferential Analysis of Maliciously Registered Domains (INFERMAL), a project funded by ICANN and run by KOR Labs, the team that produces NetBeacon MAP data. The project will collect and analyze domain name registration policies pertinent to would-be attackers, including registration features such as an API registration panel, an ability to register in bulk, accepted payment methods (credit card, Bitcoin, or WebMoney), and retail pricing.
In the meantime, be sure to download our latest NetBeacon MAP: Monthly Analysis and check out NetBeacon MAP: Interactive Charts where you can isolate phishing and malware data to look for changes over time.
If you’re a registrar or registry, sign up for our completely free NetBeacon MAP: Individual Dashboards for registries and registrars to understand phishing and malware in your zone, as well as mitigation and the types of registration (benign but compromised compared to malicious)—a really important factor for deciding which mitigation action should be taken. Or contact us to schedule time to walk through your data.